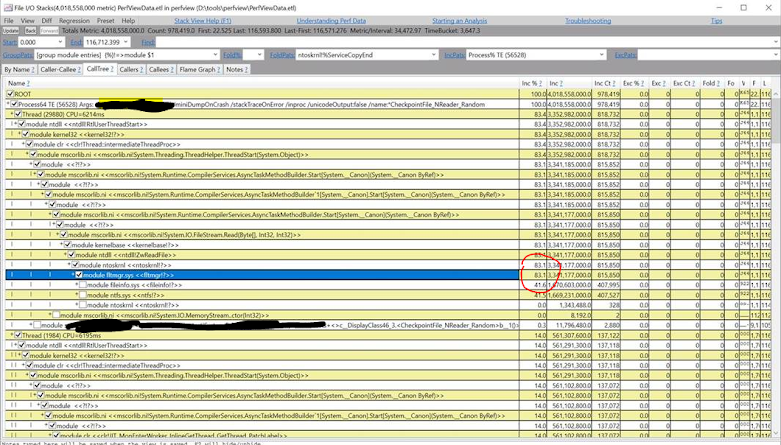
Let's take an example of read latency of a database. I had written a read performance test where I issued many read requests to the database and computed the latency. I scheduled multiple test runs. Most of the test runs had P99 under 1 msec, while in a few runs, it was as high as 7 msec.
I knew file io could be a bottleneck. So, I looked at "File I/O stacks" view and looking at high "Inc %" of time spent in file system, I convinced myself that file io is the bottleneck.
So, this is the best that we could do.
I talked about this with my team members. We found that my findings were not convincing. We next wanted to look into what happened during 10 msecs of slowest requests.
Perfview has a Start/Stop Activity feature where we can track progress of a request over async Tasks (more on it in future blog). It looked useful to what I was trying to do.
So, my plan was:
- Use start/stop activity feature to track down the slow requests.
- Find out why they are slow from the profile by looking at the CPU.. (fingers crossed)
To find slow requests, I looked at “Events” view in Perfview. Then selected my custom request start/stop ETW events, split text by putting "DURATION_MSEC, ActivityID" in "columns to display", then sorting by DURATION_MSEC. "Time Msec" column gives end time for request during “Read/Stop” event. Start time is Time Msec - DURATION_MSEC. Please see below snapshot.
I looked what was running on the CPU during some random slow requests by restricting Perfview CPU sample view to start and end time of the request.
It came out to be Garbage Collection (GC). [ Overall CPU profile did not show GC functions in top 40 functions, which is the main summary of this blog ]
Example of one of a 9 msec slow read request shows GC was running on the CPU most of the time:
I tweaked around with different GC settings and we could reduce the GC for our test app from 7 msec P99 to less than1 msec.
App was using Workstation GC (notice WKS in above stack trace). We switched to Server GC and latency came down to 3 msec. We disabled GC completely during test run and latency reduced to below 1 msec.
This convinced us that we don’t have other bottlenecks in read path other than Garbage Collection. Maoni Stephens from .net gc team has great GC documentation on tuning app for GC impact.
Final numbers:
|
Server GC |
GC running during test run |
P99 |
|
Disabled |
Yes |
7 msec |
|
Enabled |
Yes |
3 msec |
|
Enabled |
No |
< 1 msec |


Comments
Post a Comment